
Fuel and Oils Expenditures in the Agricultural Sector
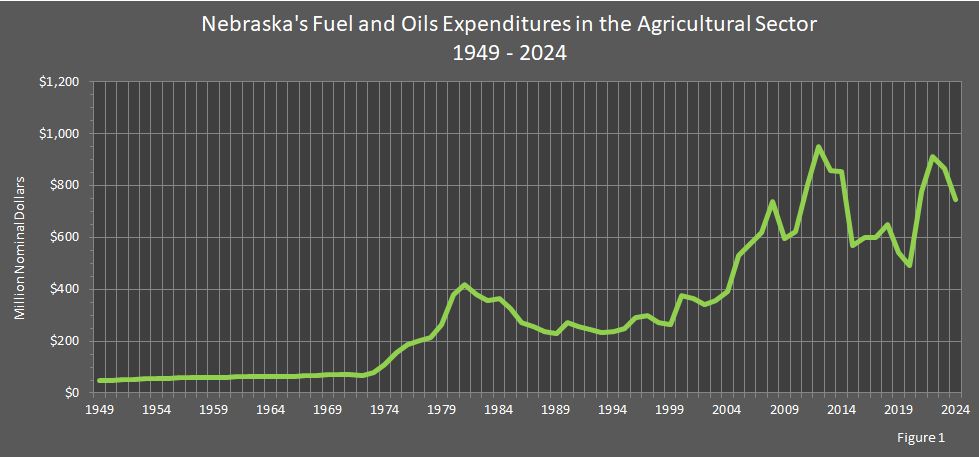
Expenditures on fuel and oils jumped to $746.3 million in 2024, which was a 13.7–percent decrease from 2023 expenditures of $846.3 million.
A record high was set in 2012 at $948.0 million. The annual expenditures for fuel and oils in the agricultural sector in Nebraska are listed in the data table and graphed in Figure 1 below. The expenditures are in nominal dollars to provide a better comparison.
Starting with the year 2008, data for the fuel and oils category is separated into diesel, gasoline and gasohol, liquid petroleum gas, natural gas, oils and lubricants, and all other fuels.
| Attachment | Size |
|---|---|
| 1949 - 2024 Total Fuel and Oils | 47.63 KB |
| 2008 - 2024 Diesel | 45.05 KB |
| 2008 - 2024 Gasoline and Gasohol | 45 KB |
| 2008 - 2024 Natural Gas | 44.94 KB |
| 2008 - 2024 Oils and Lubricants | 44.99 KB |
| 2008 - 2024 Propane | 44.84 KB |
| 2008 - 2024 All Other Fuels | 44.79 KB |
Sources: Farm Income and Wealth Statistics - Production Expenses. United States Department of Agriculture, Washington, DC. Nebraska Department of Water, Energy, and Environment, Lincoln, NE.
This report was updated on July 29, 2026.
Typically, there is one year between updates.